
Category:
Description:
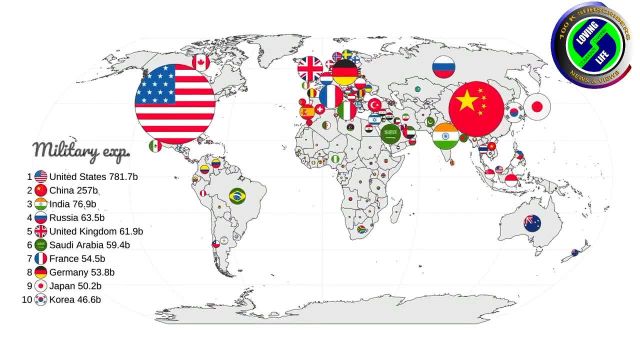
Visual Capitalist has created a video showing the countries of the world by 20 key metrics. It collates data from the World Bank and graphically compares metrics such as populations, gross domestic products, military expenditure, and fuel and technology exports. The data was sourced in July 2022 and contains the latest available data for each country.


